

Track Record
It's important to realize that the effects of compounded returns cause seemingly small differences to accumulate into amounts that are rather significant for your lifestyle in retirement. Our help can have a very large impact on your ending wealth.

Ray Meadows, the investment manager and president of Berkeley Investment Advisors, has managed his personal portfolio since 1999. This period included two major market valuation bubbles and subsequent crashes. A key lesson of these cycles is that avoiding the severe losses that follow speculative peaks in the market produces superior long run returns.
Looking at the long run is important because it is the erratic results in the short run that can lead to emotional decisions that wreck your chances for superior long run returns. Ray's conviction in his analytical abilities and investment skill allow him to stay the course and reap the rewards of his focus on business and economic fundamentals. After all, in the long run cash flows over-rule emotions in the investment world. Our strategies are designed to outperform over periods of longer than 5 years under normal market conditions. We will tend to underperform in speculative driven bull markets because we actively manage risk; we are unwilling to accept the deep losses that inevitably follow from investing in over-valued stocks near the peak of the market. In the long run this will produce higher returns by preserving capital during large down moves so that it can be deployed when returns become more attractive relative to risks.
This requires patience to focus on future returns (as opposed to the recent past) and reduce risks as the market advances. This may cause underperformance relative to equity indices near the top of the market, but over the long run if will be worth it. Because of this dynamic, in recent years Berkeley Investment Advisors has emphasized the advantages of fixed income strategies as a means to achieve good returns relative to risks as equity markets approach historically extreme valuations.
Client Returns
At Berkeley Investment Advisors, we implement our investment strategies in a number of different risk portfolios. We allocate client money among these strategies according to their risk tolerance. Although we have two equity investment strategies that we utilize for clients, our emphasis is currently on fixed income strategies as these offer more attractive returns relative to risks at this point in the economic and market cycles. Here we report our returns for the two main income oriented portfolios: Long-Term Income and Short-Term Income.
Long-Term Income Portfolio Strategy and Performance
The Long Term Income portfolio is a fixed income portfolio that focuses on intermediate to long term maturity bonds. Typically longer maturity bonds offer higher interest rates (yields) than shorter maturity bonds and are more sensitive to changes in interest rates. We measure interest rate sensitivity risk as duration. This tells us how big a change in price we can expect when interest rates change.

Typically a long term bond fund strategy would own bonds with durations above 8 given that 10 year treasury bonds have duration of 9.25. If we held a bond with duration of 8 when rates went up 1% we would expect the bond’s price to decline by 8%. As of April 2021 the duration of this portfolio is 5.4.
Besides interest rate risk there is also credit risk in our bond portfolio – the risk that borrowers may default and not pay all that is due. Lower rated bonds, known as high yield or junk bonds have a higher probability of default than higher rated bonds but compensate by paying higher interest rates. In a sense default risk is similar to equity market risk as it is correlated with the performance of the economy. Individual credit risk is managed by diversifying across a large number of issuers. In this way we insure that the extra premiums earned will not get wiped out by a few companies defaulting. Given that the weakest credits defaulted during the last recession and the overall low level of interest rates, the return versus risk trade off has been very favorable in lower rated bonds. Our strategy is to accept these credit risks to earn those extra returns.
Another source of incremental yield comes from buying closed end funds that have lower trading volumes than typical exchange traded funds. These securities can be bought at a discount to the underlying bond values (and sometimes sold at a premium). In addition these funds can enhance returns through embedded leverage at a relatively low cost of funds. In holding these securities we must endure more price volatility in down markets as retail investors tend to want to sell more at lows. As of April 2021 market conditions were providing about .6% higher yield on our portfolio than if we held the underlying bonds directly.
The portfolio is diversified across virtually all sectors of the fixed income market, including government bonds and mortgage backed securities. A good comparison index is the Barclays U.S. Aggregate Bond Index as represented by the iShares Core Total U.S. Bond Market exchange traded fund (ticker AGG). This is meant to represent the total overall U.S. bond market.
Although we first created this portfolio in February 2008, it was not continuously invested until September 2009. Therefore we cannot calculate performance further back than September 2009. The graph and table below show total returns including price and interest payments in comparison to the bond index mentioned above as implemented in the exchange traded fund (ticker AGG). Our portfolio returns calculated here are based on a particular client’s account and have been reduced by annual fees of 1.25% which would apply to new accounts above $500,000 but below $1 million.
Returns by Year
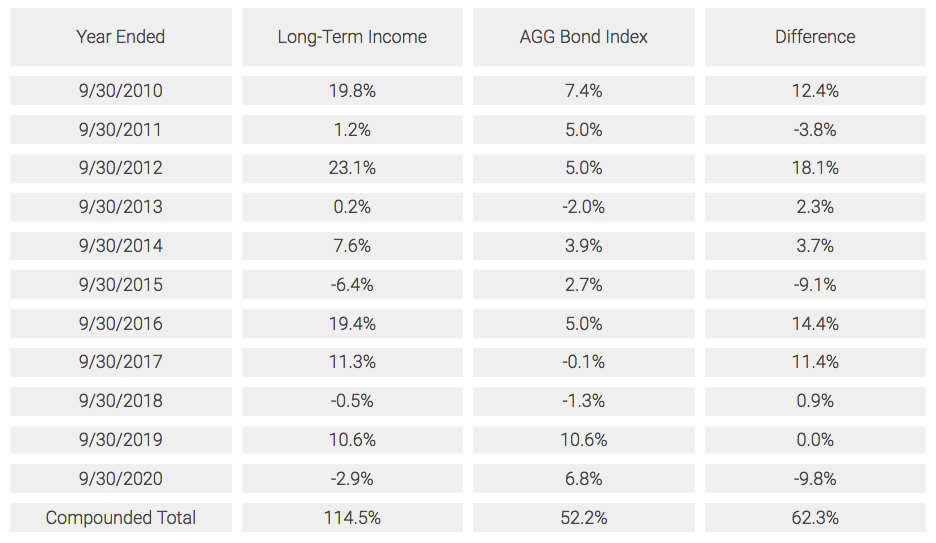
Long-Term Income vs AGG ETF

The annualized rate of return from September 30, 2009 to September 30, 2020 has been 7.93%. The table above makes it clear that the strategy exhibits significant volatility in returns and that poor performance is eventually followed by strong performance that tends to make up for the periods of lower returns. Therefore this strategy is best for investors with investment horizons beyond 3 years. The market goes through cycles of risk seeking and risk aversion whose timing is unpredictable. These cycles drive shorter term returns in stocks and bonds. While we cannot know the timing of any particular cycle, we can be confident that the market will eventually swing the other way. High yield bonds are priced to deliver higher returns than the major stock indices over the next few years. As April 2, 2021, the yield on the Long Term Income Portfolio is 7.4% (before fees) while the average discount of our closed end fund holdings relative to their net asset value is about 3.6%.
Short-Term Income Portfolio Strategy and Performance
The Short-Term Income portfolio is a fixed income portfolio that focuses on short to intermediate term rate maturity loans and bonds. Typically shorter maturity bonds offer lower interest rates (yields) than longer maturity bonds and are less sensitive to changes in interest rates. This category of fixed income includes securities with floating interest rates that can reset periodically depending on market conditions. For example the rate paid could be set based on the 3-month London Interbank Offer Rate (3-month LIBOR).
We measure interest rate sensitivity risk as duration. This tells us how big a change in price we can expect when interest rates change. Typically a Short-Term bond fund strategy would own bonds with durations below 3. If we held a bond with duration of 3 when rates went up 1% we would expect the bond’s price to decline by 3%. As of April 2021 the duration of this portfolio is 1.15.
Besides interest rate risk there is also credit risk in our bond portfolio – the risk that borrowers may default and not pay all that is due. Lower rated bonds, known as high yield or junk bonds have a higher probability of default than higher rated bonds but compensate by paying higher interest rates. In a sense, default risk is similar to equity market risk as it is correlated with the performance of the economy. Individual credit risk is managed by diversifying across a large number of issuers. In this way we insure that the extra premiums earned will not get wiped out by a few companies defaulting. Given the favorable economic conditions and the overall low level of interest rates, the return versus risk trade off has been very favorable below investment grade rated bonds. Our strategy is to accept these credit risks to earn those extra returns.
Another source of incremental yield comes from buying closed end funds that have lower trading volumes than typical exchange traded funds. These securities can be bought at a discount to the underlying bond values (and sometimes sold at a premium). In addition these funds can enhance returns through embedded leverage at a relatively low cost of funds. In holding these securities we must endure more price volatility in down markets as retail investors tend to want to sell more at lows. As of April 2021 market conditions are providing about .6% higher yield on our portfolio than if we held the underlying bonds directly.
The portfolio is diversified across virtually all sectors of the fixed income market, including government bonds and mortgage backed securities. A good comparison index is the “Barclays U.S. 1-5 year Government/Credit Float Adjusted Bond Index” as represented by the Vanguard Short-Term Bond exchange traded fund (ticker BSV). This is meant to represent the short maturity U.S. bond market.
At least some clients have had money invested in this portfolio since it was created in February 2008. The graph and table below show total returns including price and interest payments in comparison to the bond index mentioned above as implemented in the exchange traded fund (ticker BSV). Our portfolio returns calculated here are based on a particular client’s account and have been reduced by annual fees of 1.25% which would apply to new accounts above $500,000 but below $1 million. Calculations are from 2/29/2008 to 2/28/2021.
Returns by Year
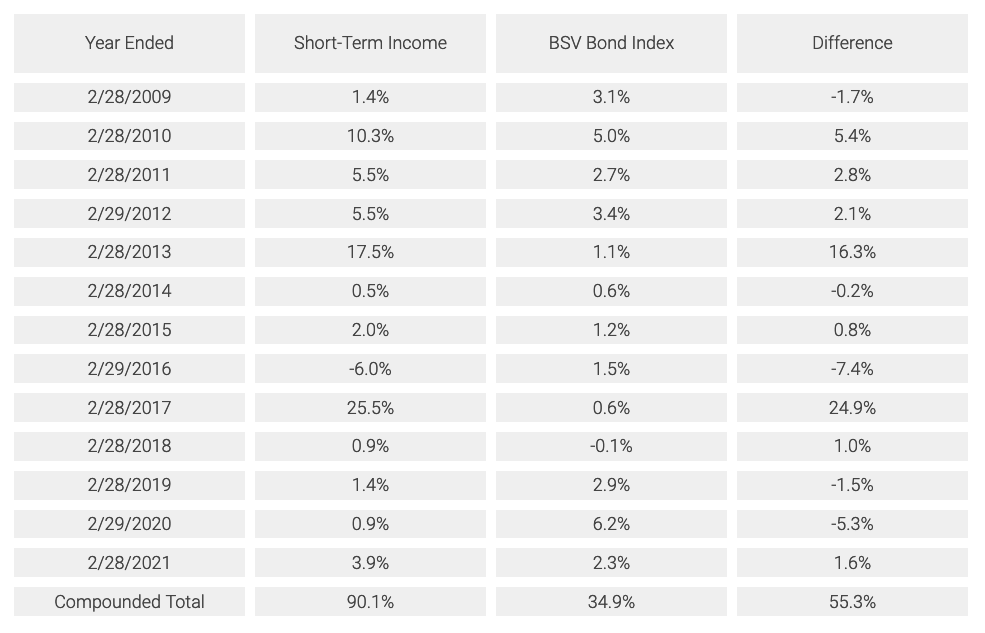
The table above and graph below show the cumulative return for the strategy from 2/29/2008 to 2/28/2021 as 90.1%. Thus the annualized rate of return over the first 13 years has been 5.07%.
The table above and the chart below makes it clear that although the strategy exhibits some volatility in returns, there is much lower risk of principal loss over a year’s time than in other strategies - such as stocks or Long-Term bonds. This is the reason that many of our clients have large allocations to this strategy: we are being cautious in what appears to be a speculation driven market. The stock market looks particularly risky using historical norms. We want to avoid large losses and have funds available to buy when the market returns to a lower level.
Short-Term Income vs BSV Bond Index
