Value Investing Discipline
Evaluating stock valuations is very important for making individual security buy and sell decisions. I.e. we must evaluate the current market price of a given stream of expected earnings as reflected in the price to earnings ratio. While expected earnings may change very slowly, the market’s value of these earnings changes minute to minute.
If we over-pay for the projected earnings of a stock we can think of this as accepting a risk premium that is in some sense too low for the risks taken on. Overpriced stocks, on average, lead to losses or returns below expected return for the fundamental risks you accept. But stocks are complicated; let’s think about a simpler example to illustrate the point. Real estate provides a useful analogy here. I like to use Real Estate because people think about it differently – meaning that most people take a long term perspective. Despite recent evidence to the contrary, most Americans will tell you that their home will go up in the long run and therefore it’s less risky. But as reality shows, if you paid 30% over the true long run market value because you bought in an overheated market or just had to have a certain house, your gains over your holding period will be much less than if you got lucky and paid 30% under the long run equilibrium market value. With regard to real estate, there is a loose but definite connection between values and the income of people who want to live there. This connection was historically enforced by lenders only lending as much money on a house as the borrower could reasonably pay back. This discipline, combined with the level of interest rates, set the Price to Earnings ratio of houses. If you buy when underwriting is lax and interest rates are low, you can pay a very high P/E ratio. But over time these will revert to the norm and falling P/E ratios imply falling house prices. The same thing happens with stocks. The negative returns we saw for the 10 years after 1999 for the S&P 500 were a direct consequence of inflated P/E multiples from 1999.

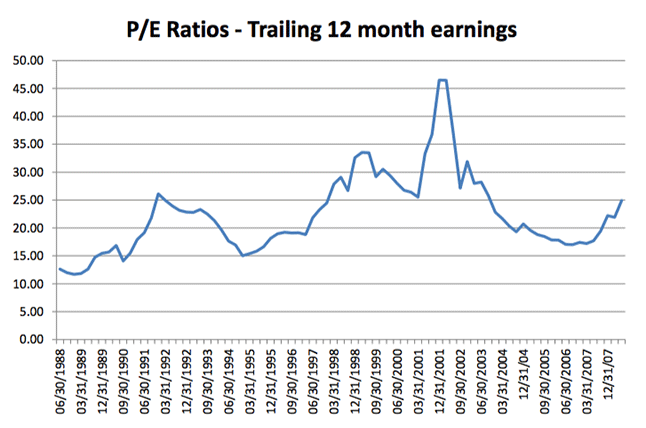
Source: Standard and Poors – based on reported earnings
In June 1999, the S&P was trading at 33 times trailing twelve month earnings. The median P/E since 1936 has been 15.5 so stocks were more than double their historical median. This is a risk that definitely can be eliminated through careful analysis. In fact, as in the real estate analogy, pricing errors can go the other way and reduce the risk of not getting your required return. If a bank forecloses on the house next door and you get to buy it for 60% of market value, you have a pretty low risk of losing money on the investment.
Underpriced stocks lead to gains or returns above required returns – or at least a cushion against your estimation errors. In 1999 I was buying REITs at historically low valuations – 10 or less times Funds from Operations which led to good returns while the rest of the market tanked.
Let’s explore this connection between valuations and risk and return a bit more. The two things that determine stock returns are the company’s returns on capital – the cash flows it generates on its investments, and how those cash flows are valued by the market.


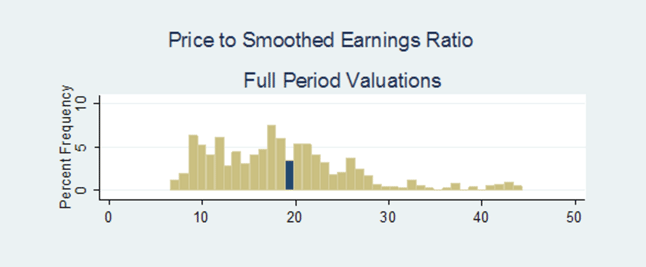
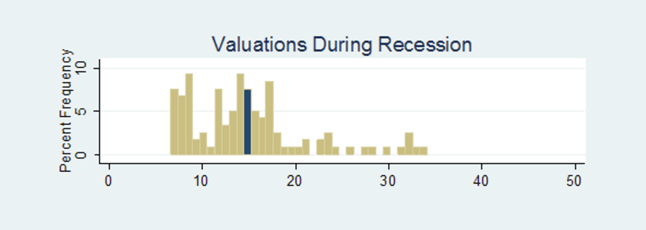
This is useful because it can give you some sense of the range of results that are possible for a given underlying earnings stream. What this tells you is that if you are buying in 1999 at a multiple of 33 then the probability of a persistently lower P/E’s 10 years out is more than 95% so you will need very high growth in income – which is also very improbable. On the other hand if you’re buying into the market when the P/E ratio is 10 or less the chance of seeing a persistently lower P/E is less than 10%. Hence, since overall GDP growth and long run earnings growth are fairly constant, your risk of negative returns is inversely related to the level of P/E at which you buy into the market.
I’ve illustrated this at the market level but of course this also applies at the company level. The underlying mathematical concept is the discount factor by which we turn future expected cash flows into values today. The more uncertain these cash flows are, the higher this rate should be. Most importantly we should pick those investments whose returns meet our goals while exhibiting the lowest risk of cash flows falling below expectations.
What I’m suggesting is that you must be constantly assessing risk and return offered by the market by evaluating both the economic environment and valuations and tuning your level of risk accordingly. When risks are high because the economy is faltering, dial back your risk exposure. Even when times are good, if valuations are very high relative to long run expectations, avoid overly expensive stocks. I don’t mean dollar price here, I mean stocks with low risk premiums relative to the norm. Conversely, if valuations fall to levels that offer above your required return for the economic risks, increase your exposure by buying the securities that offer good returns. Notice that this means buying low and selling high, the opposite of what your emotions will tell you to do.
Putting it All Together
How do we do this? First, you need to understand the historical context of what levels of return are required by the overall market. At the portfolio level, a general selloff will affect you no matter how good your picks are. So if you see a recession coming before anyone else, you should reduce risk by moving to safer fixed income investments or by going short the market indexes while still holding your good picks. Then, even if the market declines, you can make money so long as your picks outperform the market. Conversely, as the market gets cheaper relative to future earnings and growth prospects, gradually reduce hedging and rebalance away from fixed income towards undervalued equities.
For individual positions, evaluate what the risks are for achieving earnings growth expected by you and the market. Look out to the future – say 5 years and figure out the range of potential values for the stock. Pick a point in the range that you are comfortable with accepting the valuation risk on. For example, suppose we’re considering a REIT. In a normal market they will trade at somewhere between 8 and 12 times funds from operations. Given the very high uncertainty in a recession driven market like early 2009 we may well only feel comfortable that they will get to 8 times FFO in 5 years.

The other risk in a credit crisis is bankruptcy. Since refinancing debt is difficult in a recession, there is some risk that any particular REIT could go bankrupt. We need to look at their business and financial structure and assess whether we are comfortable with this risk.
Let’s consider a specific REIT: Apartment Investment Management (AIV) which traded at 4.99 on March 30th 2009. This was 2.8 times projected funds from operations for 2009. Suppose I estimated there was a 5% chance they would go bankrupt and I’d lose my entire investment – otherwise their cash flow would recover and they’d grow it by at least 25% over 5 years. Using a conservative 8 times FFO if they survive, I would calculate that this will be worth $18 per share in 5 years if they survive and along the way I will get dividends of $1 per share each year after this year. Buying at March 30th I would expect to make about 5 times my money over 5 years. But, even at the closing price of $9.25 from May 21st 2009, my return from this would be 20% annually for 5 years, and I would end up earning about 2.4 times my investment. For me, this is an attractive risk versus return proposition so long as I diversify across such opportunities to reduce the hit I would take if they did go bankrupt.
This stock went up 85% from March 30th to May 21st. Once the price rises another 50% (as it did by August 2009), the expected return drops to 10% and a multiple of only 1.6 over 5 years. Even though the stock would still be below its normal market valuation range, the return would be too low for the heightened bankruptcy risk of the 2009 market environment and there would be other opportunities with higher returns for lesser risks. Thus we sell it – despite our happy history with it.
The lesson here is that we must be disciplined about price targets both for buying and selling. Let cool headed analysis drive your decisions and don’t fall in love with your stocks. When they get so expensive that you wouldn’t buy them, it’s time to sell.

